Waste flows management by their prediction in a production company
Magdalena Scherer
Journal of Applied Mathematics and Computational Mechanics |
 Download Full Text |
WASTE FLOWS MANAGEMENT BY THEIR PREDICTION IN A PRODUCTION COMPANY
Magdalena Scherer
Department of Engineering Management,
Czestochowa University of Technology
Czestochowa, Poland
mscherer@zim.pcz.pl
Received: 1 April 2017; accepted: 31 May 2017
Abstract. In this paper we apply neuro-fuzzy systems to predict waste production in a company. Waste is produced by companies at every phase of their business, e.g. at the stage of supply, production and distribution. We used data on the production waste of one of the typical Polish manufacturing companies operating in the automotive industry. We predicted monthly waste production by data-driven learning of neuro-fuzzy systems. Neuro-fuzzy systems share with artificial neural-networks the ability to learn from data and the interpretability with fuzzy systems. In the experiments we achieved a high rate of prediction.
MSC 2010: 68T05, 60G25
Keywords: reverse logistics, artificial intelligence
1. Introduction
Consumer awareness and legal regulations are increasingly forcing manufacturers to take care of the environment. Although waste generation cannot be completely eliminated, newer solutions are emerging that minimize its effects. Reverse logistics is here to help, with the main aim of reintroducing waste into the economic system which, after proper processing, can become raw materials or semi-finished products. According to the definition of A. Mesjasz-Lech, reverse logistics covers all processes related to the flow of waste materials and related information in the system, and in particular the processes of collection, storage, transport, processing, redevelopment or possibly safe disposal, assuming that these processes will be carried out taking into account the economic and ecological efficiency, and their aim is to create real, closed systems of material circulation [1]. According to the definition proposed by Szołtysek and Twaróg, reverse logistics models the flows of waste and related information from the place of their origin to their place of management, involving the recovery of value (through re-use, recycling or reclaiming) or to the proper disposal or long-term storage to economize operation and to protect the environment [2]. The main goal of reverse logistics is to obtain a balance between economic, ecological and social effects [3]. Return logistics management is designed to shape the efficient and effective flow of waste materials and information between the waste-generating site and the place of re-incorporation into the economic system, taking into account market requirements [1]. Lack of optimal waste management solutions can increase both the mass of waste and the level of environmental pollution. Therefore, proper management of waste streams is a very important element of business operations. Its beneficial effect manifests itself in reducing the amount of material flow and wear, but also in minimizing the negative impact on the environment. Unfortunately, this is a difficult process - a complex, multi-step process that requires verification at every stage of its construction. Managing the flow of return streams in an enterprise requires proper forecasting of both the supply and demand for waste that is recoverable. It is also important to coordinate effectively in the planning and control of reverse logistics activities. Reverse logistics management also refers to the planning of the location of the return points, the structure of the return logistics system, or the valuation of goods produced from recycled materials [4].
Neuro-fuzzy systems (NFS) are a fusion of artificial neural-networks and fuzzy systems. In other words, they combine human-like reasoning based on fuzzy rules with the ability for data-driven learning. Neural networks can learn from data, however we do not have direct access to the knowledge structure as they work like black boxes. In the case of neuro-fuzzy systems, the knowledge can be obtained by learning from data but also from human experts as it is defined by straightforward IF-THEN rules. In [5], the authors used neuro-fuzzy systems for predicting water level in a reservoir. They added additional input with human decision and obtained very good prediction accuracy. In [6], a fuzzy Gaussian neural network was applied to recognize the ECG signals for ischemic heart disease diagnosis. However they preprocessed the signal with Principal Component Analysis and Discrete Cosine Transform. The final price of online auctions was predicted with NFS in [7]. The authors also explored the complex nonlinear relationship among the auction mechanisms and the final price. The experiment results showed that NFSs performed very well in this task. Short-term electricity load forecasting with neuro-fuzzy systems was researched in [8]. The authors used not only load data but also the information about the season and average temperature, and they were able to achieve a very low one-hour prediction rate. Authors of [9] predicted short-term incomplete data based on energy. Generally, NFSs can be used for numerous tasks related to classification and regression, e.g. for evaluation of bank credit [10] or healthcare efficiency [11].
Waste is produced by companies at every stage of their business, both at the stage of supply, production and distribution. The largest group of waste is the production waste, so the article focuses on it. We used data on the waste of one of the typical manufacturing companies operating in the automotive industry. Using neuro-fuzzy systems, we were able to predict waste production monthly with relatively high accuracy. The paper is organized as follows. In the next section we briefly describe neuro-fuzzy systems. Section 3 concerns data collecting, and Section 4 presents numerical experiments.
2. Neuro-fuzzy systems
Neuro-fuzzy systems are a fusion of neural networks and fuzzy logic. They combine the human-understandable reasoning in the form of IF-THEN rules, with the possibility of supervised learning, which takes place in neural networks [12- -14]. In this way, the disadvantages of both techniques are eliminated, i.e. lack of interpretability as is in the case of neural networks (black box) and learning in the case of fuzzy systems. Generally speaking, neuro-fuzzy systems reflect a variety of fuzzy systems, but creating a fuzzy model based on learning data is usually done with an algorithm derived from the artificial neural network world. The layers in these systems are different than in neural networks and reflect the blocks and operations that exist in fuzzy systems, i.e. input variables, fuzzy sets in predecessors of rules, fuzzy sets in rule consequents, inference and defuzzification. It is evident that it is no longer a homogeneous structure composed of similar neurons as in the case of traditional artificial neural networks. In addition to the ability to learn from the data, compared to neural networks we obtain an opportunity for system initialization and knowledge interpretation, as the entire neural-fuzzy system can always be interpreted as readable rules.
As in classical fuzzy systems, neuro-fuzzy systems approximate an n-dimensional function, defined in part by the learning data. Each fuzzy rule describes the local behavior of this function in the input variable space. Often, the problem of choosing fuzzy membership and fuzzy rules is a difficult task and is even impossible for humans in the case of multidimensional problems. With data-driven learning algorithms derived from neural networks, neuro-fuzzy systems can be created for any complex problem.
The most popular neuro-fuzzy model is the Mamdani system, where the antecedents and the consequents of the fuzzy rules are joined by the minimum or the multiplication operation. In this paper, such a model is used but with singleton sets in the consequent part of rule
| (1) |
where k = 1,…,N
is rule number, xi, i = 1,…, n is i-th
system input. The above rule is the same as in the general fuzzy system, but
the output fuzzy set ![]() is a singleton set, which has a nonzero membership value only in one
point of the space and zero elsewhere. Since there are N rules in the
system, we also obtain N singleton fuzzy sets after the inference
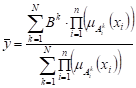
operation. The output of the system must be defuzzified, e.g. by weighted
arithmetic mean according to the formula
is a singleton set, which has a nonzero membership value only in one
point of the space and zero elsewhere. Since there are N rules in the
system, we also obtain N singleton fuzzy sets after the inference
operation. The output of the system must be defuzzified, e.g. by weighted
arithmetic mean according to the formula
 , , | (2) |
where ![]() is the activation
coefficient of the rule defined as the product of membership degrees of
individual fuzzy sets in the preceding part of the rule
is the activation
coefficient of the rule defined as the product of membership degrees of
individual fuzzy sets in the preceding part of the rule
| (3) |
This product implements the logical “AND” operation in fuzzy rules. All rules are involved in the process of determining the output value in a way that is proportional to their activation, i.e. the degree of matching to the current input. After substituting formula (2) to (1), we obtain
 . . | (4) |
The paper assumes that the input fuzzy sets (linguistic variables) are described by the Gaussian membership functions, that is
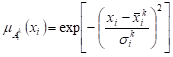 , , | (5) |
where ![]() and
and ![]() are, respectively,
the center and the width of the membership function for i-th input and
in the rule number k. From the above formula we obtain the form of the
neuro-fuzzy system with the product-type inference
are, respectively,
the center and the width of the membership function for i-th input and
in the rule number k. From the above formula we obtain the form of the
neuro-fuzzy system with the product-type inference
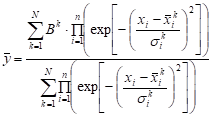 . . | (6) |
Figure 1 shows a block diagram of a structure that reflects the above formula. As it can be seen, it is similar to a multi-layer neural network and, for example, the error backpropagation algorithm can be used to adjust all its parameters from data. The learning algorithm adapts the input and output parameters of the membership functions to best fit the behavior of the system to the training data.
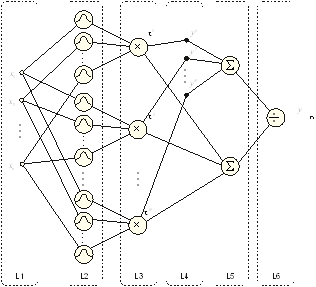
Fig. 1. Neuro-fuzzy system described by formula (6)
The neuro-fuzzy system shown in Figure 1 has n inputs and N rules. Membership functions in rule antecedents (Layer L2) are multiplied in Layer L3 to calculate the degrees of activation of each rule. In L4, the degrees of activation of the rules are multiplied by the output fuzzy sets of the singleton type. Layers L5 and L6 perform defuzzification as a weighted average. Knowledge in the form of fuzzy rules can be collected by experts or in the learning process from the data. The most commonly used membership functions are Gaussian and triangular functions in the antecedent part of the rules, and the singleton functions in the consequent part of rules.
One of the most popular architectures is ANFIS [15] (Adaptive Network Based Fuzzy Inference System), which is an implementation of the Takagi-Sugeno system, consisting of five layers. The first layer contains the membership functions of the input fuzzy sets. The second layer implements T-norms to calculate the levels of rule activation. The third layer normalizes the activation levels of the rules so that the last layer can only sum all the output values of the rules to calculate the final output value of the system. Layer 4 includes linear functions of input values. The parameters of the input membership functions and the parameters of the linear functions in the fourth layer are changed by the error backpropagation algorithm during training from data.
Learning can be accomplished, for example, by the error backpropagation algorithm, which iteratively changes the values of the membership function parameters at successive training data presentations, based on the gradient of error between the desired and the output signal.
Neuro-fuzzy systems share with neural networks the advantages of data-driven learning and modeling systems without knowing their exact mathematical model. In relation to neural networks, they have the advantage of fuzzy knowledge interpretation, which makes it possible to use expert knowledge or extraction of knowledge after learning from data. The use of neuro-fuzzy systems in reverse logistics enables one to predict the size of waste streams. This allows the company to manage waste streams more effectively. Fuzzy logic allows one to apply expert knowledge in the form of rules. Furthermore, after the learning from data, a reverse process is also possible, i.e. extraction of knowledge from the system trained from the data. Waste from production is transferred to the recovery and disposal organization.
Neural-fuzzy networks are used to solve various problems. However, every problem requires a proper network adaptation. The appropriate network topology must be chosen, the number of neurons in layers and sometimes the number of network layers. Next, we need to prepare a training and testing set. The network must be trained and afterwards tested with data not used during training. It was decided to use neuro-fuzzy systems to predict the amount of waste streams as they allow to create a data-driven system and the use of knowledge in the form of readable rules for humans. In addition, it is possible to extract knowledge from the data-learned system into fuzzy rules.
3. Data collecting and preparation
The data used in the paper was made available by one of the typical manufacturing companies. The waste catalog according to the Regulation of the Ministry of the Environment of 9 December 2014 on the waste catalog divides the waste according to the source of their formation into twenty groups. Each type of waste is assigned a six-digit code, and in the data used in the paper, there is waste from the following groups: 08 01 11 - Waste paint etc., 15 01 02 - Plastic packaging, 13 01 10 - Mineral hydraulic oils, 15 01 10 - Packaging contaminated by hazardous substances, 15 02 02 - Sorbents, 15 02 03 - filter materials, wiping cloths, 16 02 13 - Used equipment containing dangerous components.
The nature of the production process in the researched enterprise results in certain dependencies between the generated waste of the groups being distinguished. Indication of the existence of links between different categories is one of the basic objectives of economic research. Correlation is a measure of the relationship between variables, which is determined by the correlation coefficient [16]. The seven selected waste groups were analyzed for correlation to determine to what extent the data are interrelated. For this purpose, the Pearson correlation coefficient was calculated for the respective waste groups. This coefficient has a value in the range <‒1; 1>, where zero means total absence of correlation, 1 means complete positive correlation, and ‒1 complete negative correlation. Positive correlation means that the value of the second variable increases with the increase of the first variable. In the case of negative correlation, the increase in the value of the first variable causes the second variable to fall. The Pearson correlation coefficient is expressed by formula (7)
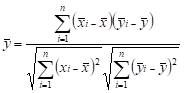 , , | (7) |
where xi
is i-th value of variable x, yi unit i-th
value of variable y, ![]() is arithmetic mean of variable x,
is arithmetic mean of variable x, ![]() the arithmetic
mean of variable y, and n is the number of
observations. The obtained results from the correlation analysis are presented
in Table 1. Correlation coefficients indicate that the data are not correlated,
thus all waste groups will be predicted separately.
the arithmetic
mean of variable y, and n is the number of
observations. The obtained results from the correlation analysis are presented
in Table 1. Correlation coefficients indicate that the data are not correlated,
thus all waste groups will be predicted separately.
Table 1
Correlation coefficients between individual monthly waste amounts
|
Waste |
80111 |
150102 |
130110 |
150110 |
150202 |
150203 |
160213 |
|
80111 |
1.00 |
0.20 |
‒0.04 |
0.09 |
0.23 |
‒0.05 |
‒0.08 |
|
150102 |
0.20 |
1.00 |
‒0.03 |
0.03 |
‒0.01 |
‒0.04 |
‒0.04 |
|
130110 |
‒0.04 |
‒0.03 |
1.00 |
0.02 |
‒0.01 |
‒0.04 |
0.07 |
|
150110 |
0.09 |
0.03 |
0.02 |
1.00 |
0.17 |
‒0.13 |
0.02 |
|
150202 |
0.23 |
‒0.01 |
‒0.01 |
0.17 |
1.00 |
‒0.06 |
0.06 |
|
150203 |
‒0.05 |
‒0.04 |
‒0.04 |
‒0.13 |
‒0.06 |
1.00 |
‒0.04 |
|
160213 |
‒0.08 |
‒0.04 |
0.07 |
0.02 |
0.06 |
‒0.04 |
1.00 |
Predictability and ability to assess future events play a key role in business operations. The uncertainty of the future and the time interval from the moment of the decision to its result, makes it necessary to find appropriate prognostic methods, which are burdened with the smallest error and which are simple and inexpensive to use. With accurate forecasting, decision making becomes much easier which improves enterprise management. Forecasts should be the basis for creating business action plans. Still, new methods of forecasting are being sought, where the results will be as accurate as possible, and the methods will be simple and inexpensive to use.
4. Numerical experiments
Experiments for the researched company were performed in Matlab, which is a computational environment that allows manipulation of arrays, plotting functions and data, implementing user interfaces and algorithms in its own programming language. We used the Fuzzy Logic Toolbox to create fuzzy systems. It allows one to build fuzzy systems by defining fuzzy sets and rules and then to test the system. Alternatively, the system parameters can be obtained by learning from data. The generated fuzzy system can be used as a Matlab function or, alternatively, the system parameters can be exported for use in an external program. Figure 2 shows the monthly production for all the collected groups of waste.
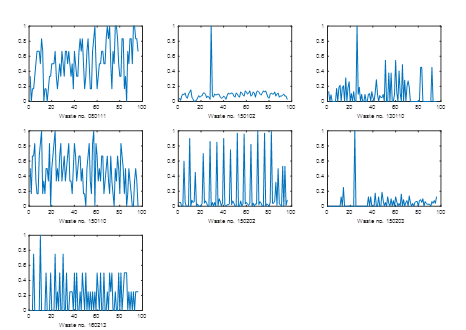
Fig. 2. Monthly amounts of individual waste in the years 2009-2016 in the examined enterprise. Data is normalized
We predicted the next month’s waste production amount using data from three of the previous months. Thus, the fuzzy system has three inputs and one output. During experiments we checked that the minimal acceptable number of input fuzzy sets for each input is three thus we used three input fuzzy linguistic values distributed evenly to form descriptions “small”, medium” and “large”. A three-dimensional feature space was covered with a grid partition that resulted in 27 fuzzy rules and the same number of the output singleton values. During the data-driven learning process, all the parameters were adjusted by the backpropagation algorithm. The training was performed for 1000 epochs (i.e. full presentations of a dataset). The root-mean-square error during the training process for three datasets is presented in Figure 3.
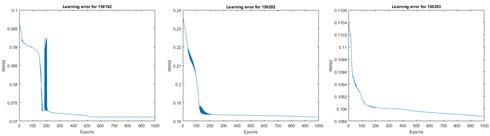
Fig. 3. Learning errors for three example waste data
The training process was long enough to achieve the lowest possible learning error for a given fuzzy system configuration. The results are presented in Table 2.
Table 2
Root-mean-square error after 1000 epochs of learning for all waste types
|
Waste type |
80111 |
150102 |
130110 |
150110 |
150202 |
150203 |
160213 |
|
RMSE |
0.086 |
0.071 |
0.096 |
0.133 |
0.182 |
0.108 |
0.178 |
Analyzing the results, we can observe that the final accuracy depends on the variability of a given dataset. However, obtained results are satisfactory. The results would be better if we used larger fuzzy systems, i.e. with more input fuzzy sets that create a denser feature space grid partition.
5. Conclusions
Waste, especially production waste, is a serious problem in today's economy. It is a big threat to the environment. Waste generated by the production activity is the main subject of reverse logistics due to the scale of occurrence and the degree of danger to the environment. Reverse logistics is designed to incorporate waste after proper recycling into the logistic chain as raw materials or semi-finished products.
The enterprise analysed in the paper for environmental purposes adopted not only the minimization of the amount of generated waste, but, above all, the possibility of bringing the processed waste back into the economic cycle as much as possible. Quantitative assumptions for projects reducing the negative impact of generated waste on the environment can only be fulfilled if it is possible to predict the size of waste streams. Various predictive methods are used to manage reverse logistics. They allow for accurate forecasting of waste, which translates into quantitative planning of return flows. The research has shown that forecasts of waste generated using neuro-fuzzy networks due to a relatively small forecast error may be the basis for the decision-making process in terms of return flows.
After the data-driven training process, the systems predicted the amount of waste produced on the basis of the previous months. Quantities of waste in the preceding months were inputs to the neuro-fuzzy system, and the output was the predicted quantity in the following month. The error, that is, the difference between the desired quantity and the system output has reached a very low value, so that the forecasts made during the experiments were accurate in 81 to 93%, depending on the given waste. It would be possible to achieve even higher accuracy, sacrificing the size of the fuzzy system. However, it would worsen the interpretability of the fuzzy system. Forecast accuracy translates into better management of waste streams.
References
[1] Mesjasz-Lech A., Efektywność ekonomiczna i sprawność ekologiczna logistyki zwrotnej, Wydawnictwo Politechniki Częstochowskiej, Częstochowa 2012.
[2] Szołtysek J., Twaróg S., Logistyka zwrotna, Teoria i praktyka, Polskie Wydawnictwo Ekonomiczne, Warszawa 2017.
[3] Klaus P., Logistics as a science of networks and flows, Logistics Research 2010, 2, 55-56.
[4] Pokharel S., Mutha A., Perspectives in reverse logistics: A review, Resources, Conservation and Recycling 2009, 53.
[5] Chang F.J., Chang Y.-T., Adaptive neuro-fuzzy inference system for prediction of water level in reservoir, Advances in Water Resources 2006, 29, 1, January, 1-10.
[6] Neagoe V.E., Latin L.F., Grunwald S., A neuro-fuzzy approach to classification of ECG signals for ischemic heart disease diagnosis, AMIA Annual Symposium Proceedings, 2003, 494-498.
[7] Lin C.S., Chou S., Weng S.M., Hsieh J.C., A final price prediction model for english auctions: a neuro-fuzzy approach, Quality & Quantity 2013, 47, 2, February, 599-613.
[8] Çevik H., Çunkaş M., Short-term load forecasting using fuzzy logic and ANFIS, Neural Comput. Appl. 2015, 26, 6, August, 1355-1367.
[9] Rivero C.R., Pucheta J., Laboret S., Sauchelli V., Patińo D., Energy associated tuning method for short-term series forecasting by complete and incomplete datasets, Journal of Artificial Intelligence and Soft Computing Research 2017, 7, 1, 5-16.
[10] Konovalova N., Kristovska I., Kudinska M., Credit risk management in commercial banks, Polish Journal of Management Studies 2016, 13, 2, 90-100.
[11] Stefko R., Gavurova B., Korony S., Efficiency measurement in healthcare work management using malmquist indices, Polish Journal of Management Studies 2016, 13, 1, 168-180.
[12] Scherer R., Multiple Fuzzy Classification Systems, Springer 2012.
[13] Scherer R, Rutkowski L., Neuro-Fuzzy Relational Systems, International Conference on Fuzzy Systems and Knowledge Discovery, November 18-22, 2002, Singapore, 44-48.
[14] Prasad M., Liu Y.-T., Li D.L., Lin C.-T., Shah R.R., Kaiwartya O.P., A new mechanism for data visualization with TSK-type preprocessed collaborative fuzzy rule based system, Journal of Artificial Intelligence and Soft Computing Research 2017, 7, 1, 33-46.
[15] Jang J.-S. R., Sun C.-T., Mizutani E., Neuro-Fuzzy and Soft Computing: A Computational Approach to Learning and Machine Intelligence, Prentice Hall, 1996.
[16] Szajt M., Przestrzeń w badaniach ekonomicznych, Sekcja Wydawnictw Wydziału Zarządzania, Częstochowa 2014.